Temperature
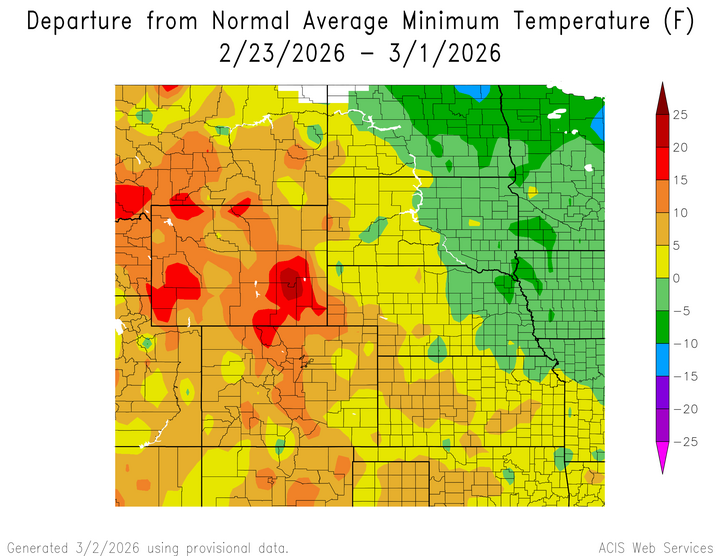
Temperatures were above normal in the majority of the region. The highest temperatures were greater than 15°F above normal in northcentral, southwestern and southeastern Wyoming, and a small part of northcentral Colorado. The lowest temperatures were 6°F to 9°F below normal in northeastern North Dakota.
Temperatures in scattered parts of western Kansas and a small part of eastern Colorado reached 20°F to 25°F above normal. The hottest temperature was 72°F in Pueblo, Colorado, which is 18°F above normal for the area. The lowest temperatures were 5°F to 10°F below normal in a small part of eastern Wyoming.
Temperatures in northeastern North Dakota reached 10°F to 15°F below normal. The coldest temperature was 1°F in Grand Forks, North Dakota, which is 7°F below normal for the area. The highest temperatures were 20°F to 25°F above normal in eastern Wyoming.

| 
| 
|
Precipitation
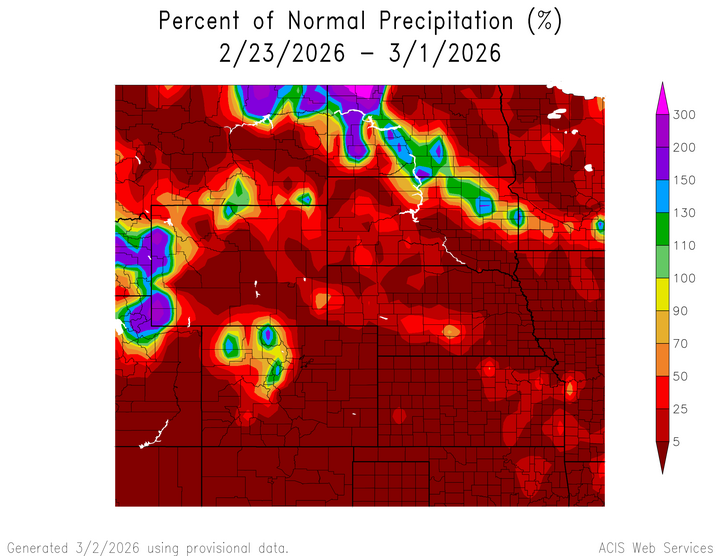
Precipitation amounts were below normal in the majority of the region, ranging from 5 percent of normal in most of Kansas, Nebraska, Colorado, central and eastern Wyoming, across central and southern South Dakota, and northcentral and eastern South Dakota to more than 300 percent of normal in northwestern North Dakota. The Lewis Lake in Wyoming received 2.4 inches of precipitation with most falling on the 24th and 25th. Drought continues in the region. D0 (abnormally dry) conditions increased from 60 percent to 62 percent. In the region, Kansas experienced the highest increase in D0 conditions by 4 percent.
| 
|